The data arguably supports the popular belief that Congress has become more polarized since the 1980s.
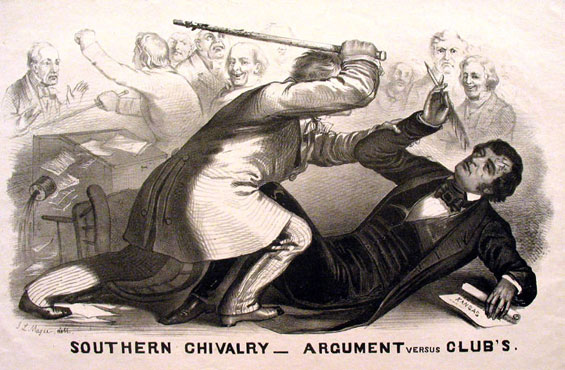
I generally scoff at those who would say that we are more polarized as a nation now that at any time in our history. I think that ignores the troubled first century of our nation’s existence. Unlike the antebellum years, Representatives do not go armed to the Floor in fear of violence from their colleagues, and no one has been caned on the Floor in living memory.At worst, Members trade harsh language on news shows these days.
In my previous post I described my use of “cosponsorship” data. When a Representative introduces a bill, they are listed as its chief sponsor. Many chief sponsors will seek out or accept “cosponsors”: other Representatives that add their name formally and publicly as a supporter of the bill (an example: H.R. 721, sponsored by Rep. Jenkins, cosponsored by 250 others; and 218and51.com’s data on H.R. 721).
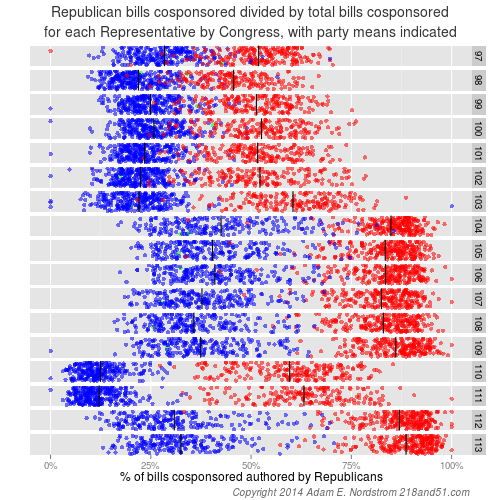
For each Representative I calculated the number of bills authored by Republicans that they cosponsored and divided that by the total number of bills that they cosponsored. I then plotted this for each Congress back to the 97th Congress (starting in 1981). Each dot represents an individual Representative. The further to the left they are plotted, the more the bills they support tend to be written by Ds, the further to the right, the more the bills they support bills written by Rs.
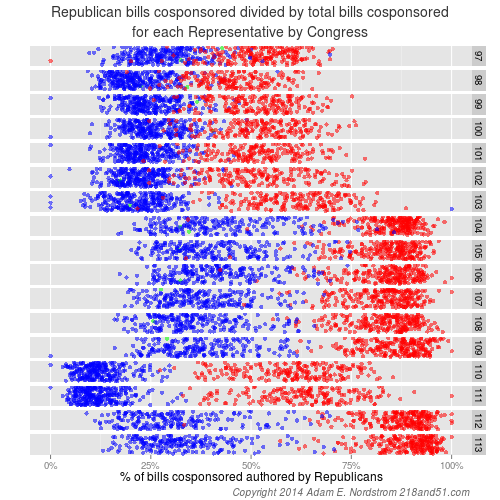
It appears that the party in control of Congress maintains a much tighter grouping in the plot in recent Congresses. Members of the majority party are more likely to cosponsor bills authored by members of their own party than to cross the line to support a member of the other party. This party cohesion can disintegrate and then reform itself relatively quickly. For example, when then-Speaker Pelosi and the Democrats took control of the House in the 110th and 111th Congresses, Republican cohesion appears broken, while Democratic cohesion appears to tighten. This reverses again with the Tea Party victories in the 112th.
By plotting the mean percentage for Republicans and Democrats as vertical lines, another interesting trend emerges:

The R mean has shifted to the right since the 1980s – Rs have become less likely to cosponsor D bills. Examining the spread between the D mean and the R mean seems to support an argument for increasing polarization. In every year but one since 1981, the spread between the D mean and R mean has increased:
| Congress | R Mean | D Mean | Spread |
| 113 | 88.65 | 32.53 | 56.12 |
| 112 | 86.98 | 30.85 | 56.12 |
| 111 | 63.19 | 12.11 | 51.07 |
| 110 | 59.64 | 12.46 | 47.18 |
| 109 | 86.09 | 37.43 | 48.65 |
| 108 | 82.99 | 35.74 | 47.24 |
| 107 | 82.51 | 37.76 | 44.76 |
| 106 | 83.52 | 40.97 | 42.55 |
| 105 | 83.45 | 40.38 | 43.07 |
| 104 | 84.87 | 42.52 | 42.35 |
| 103 | 60.45 | 22.07 | 38.38 |
| 102 | 52.22 | 22.45 | 29.77 |
| 101 | 51.64 | 23.47 | 28.17 |
| 100 | 52.6 | 25.77 | 26.83 |
| 99 | 51.32 | 24.93 | 26.4 |
| 98 | 45.64 | 21.93 | 23.71 |
| 97 | 51.9 | 28.41 | 23.49 |
While much of this increase appears attributable to Rs being less willing to cosponsor D bills, in the 110th and 111th Congresses when the D’s shifted to the left, the overall spread only dropped slightly, and the spread remained wide and became wider after Republicans resumed control in the 113th.
There are lots of other things going on in the data here. Lots of stats 101 is left out of this analysis. I didn’t take into consideration the number of Rs vs. Ds in each Congress, or the number of bills authored by each party. A true “bipartisan” may not support 50% R bills if the Congress were 60% Ds… I’ll save that for another post.
But that said, the data does appear to indicate a decreased willingness to partner with members of another party to advance legislative concepts. So long as that remains the trend, the terms “polarized” or “unproductive” may continue. Whether or not that is a “good” thing, depends on your personal perspective.
Credits:
- Cosponsorship Data: Congress.gov and previously, thomas.loc.gov
- Data collection and processing: Adam Nordstrom
- Wickham, H., ggplot2: elegant graphics for data analysis, Springer New York, 2009, http://ggplot2.org/
- Auguie, B., gridExtra, http://cran.r-project.org/web/packages/gridExtra/gridExtra.pdf
- Magee, John L., “Southern Chivalry”, 1856, http://en.wikipedia.org/wiki/Caning_of_Charles_Sumner#mediaviewer/File:Southern_Chivalry.jpg