With the first session of the 114th Congress in the books several observations occur to me: (1) I’ve now worked in or around Congress for over 9% of its history – that seems like a lot to me; and (2) Congress has changed a lot in 20 years.
Over time Republicans have become less willing to cosponsor legislation and Republicans are much more alike in their willingness to cosponsor bills than Democrats. Democrats show more variety in their willingness to cosponsor bills[1], and on average do so more often than Republicans. Democrats have recently shown less willingness to cosponsor bills (as weighted by the number of bills outstanding) and this tendency has varied congress to congress. Since the 104th Congress Republicans have demonstrated a decreasing tendency to cosponsor bills when weighted by the number of bills outstanding.
In short: If your job is to get congressmen to support a legislative initiative—and to prove their support in an official way prior to a vote—then your job has become much harder in the last 20 years.
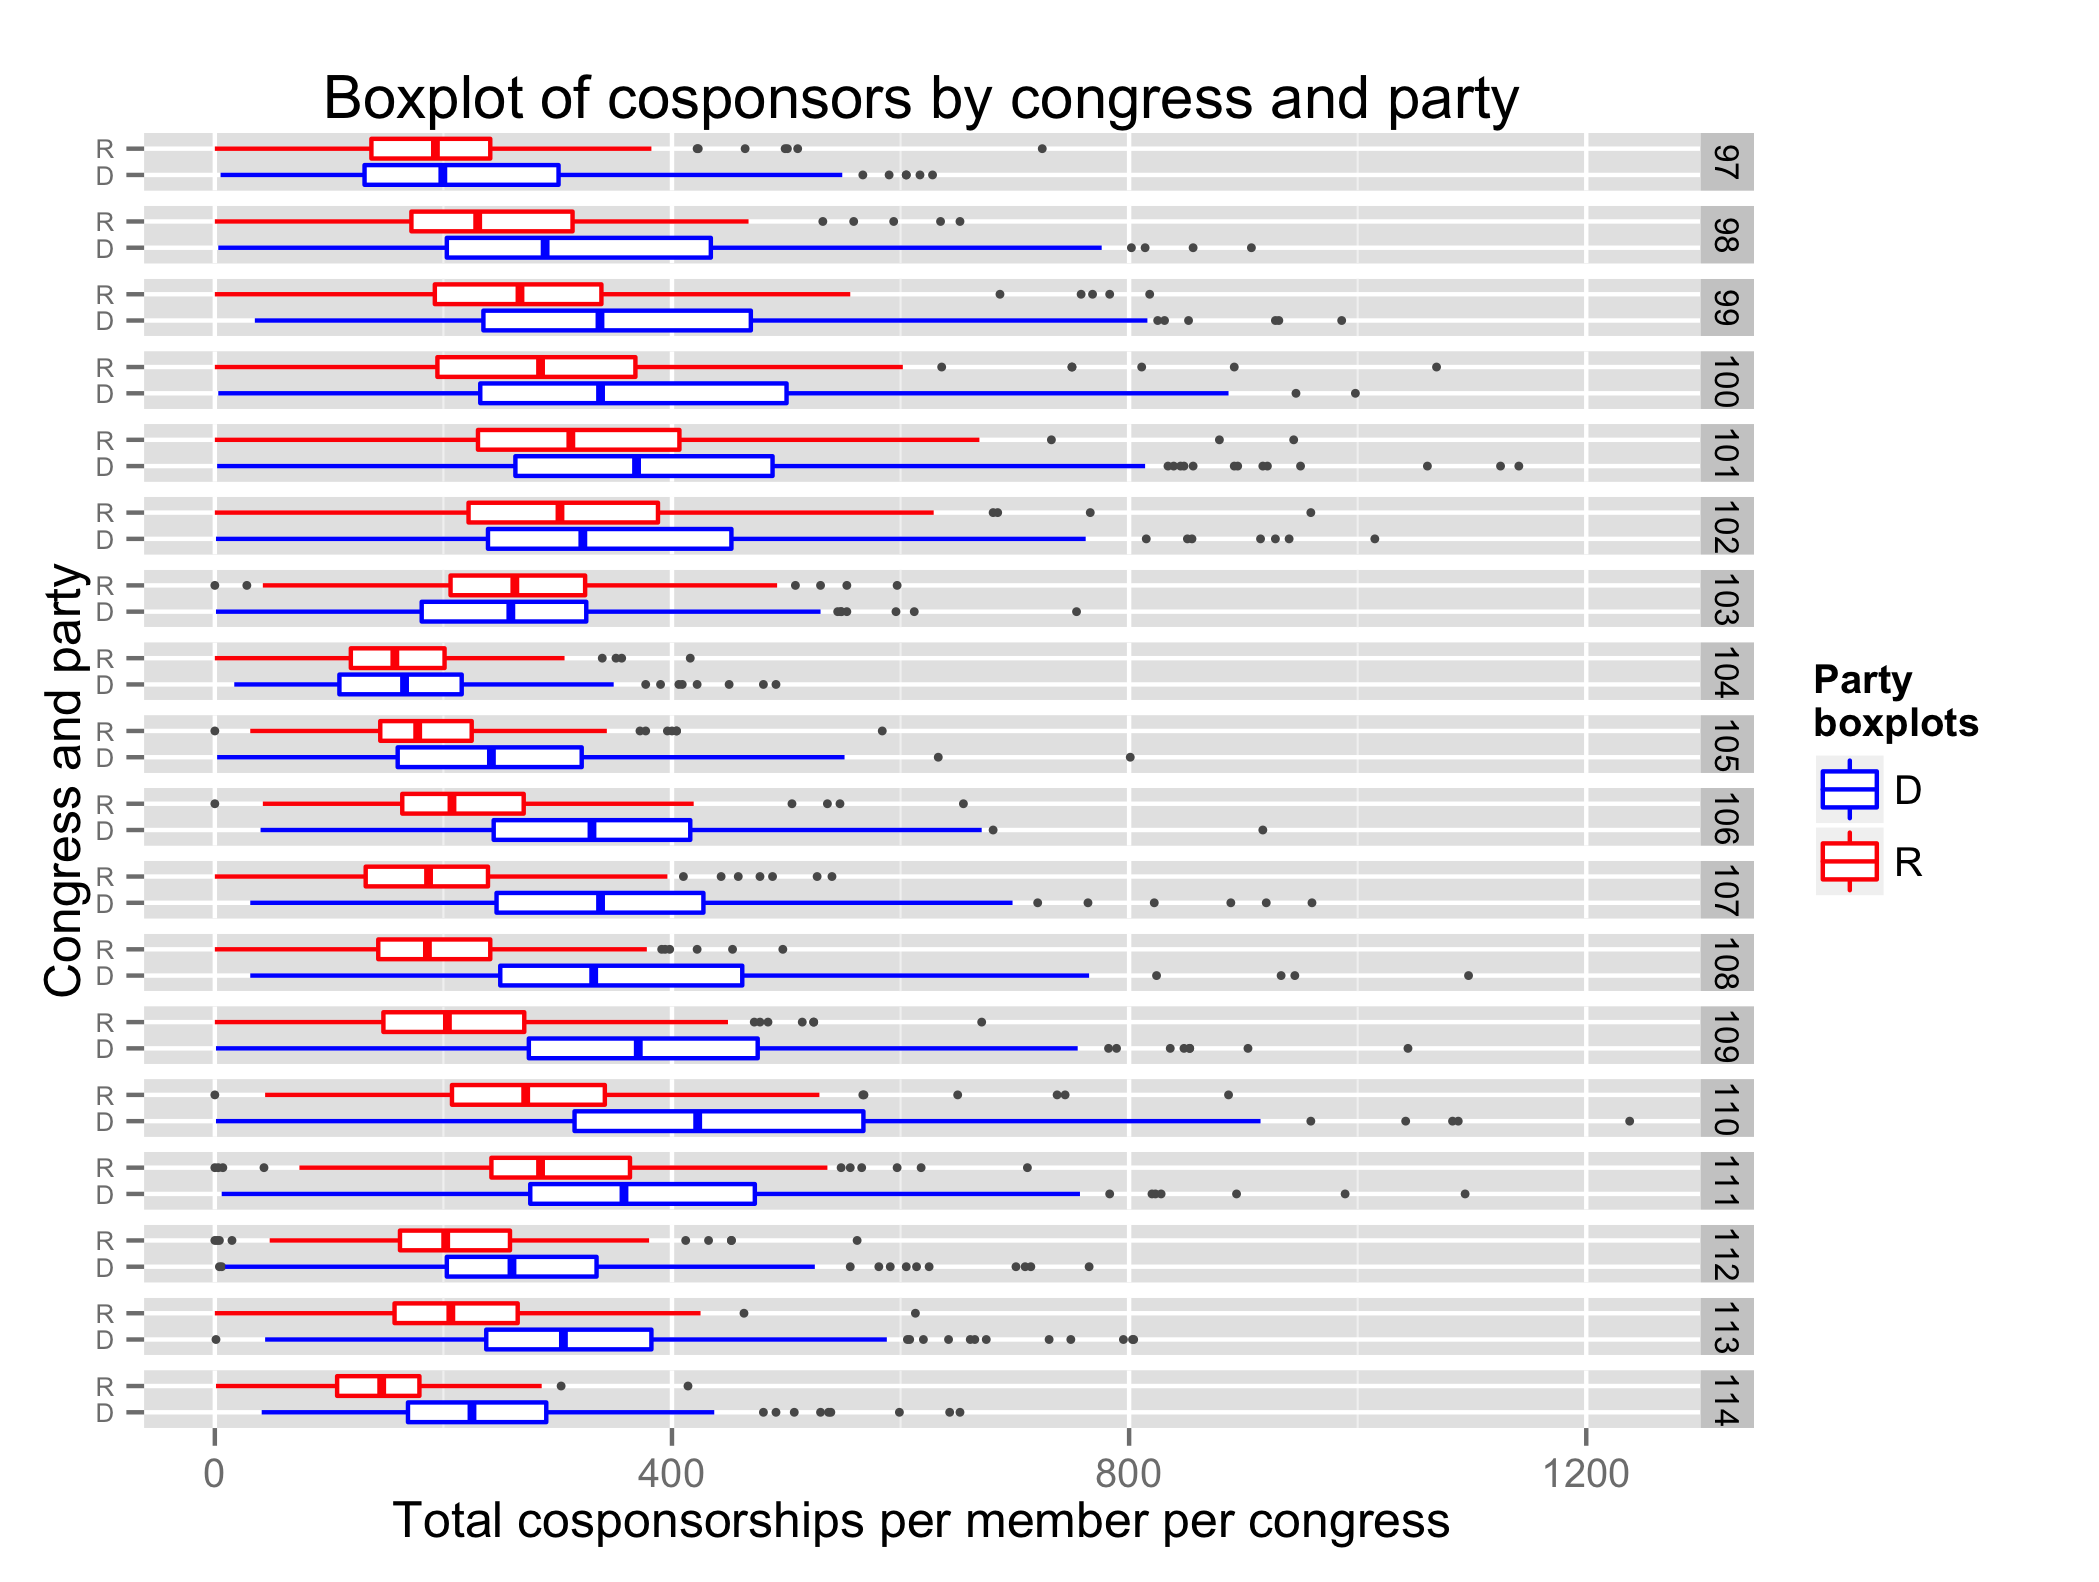
I started on the Hill in the 104th Congress in the immediate wake of the Revolution of 1994. The 40-year Democratic majority had just come to an end. The behavior of Representatives in this time changed significantly. For example, the number of bills cosponsored by each member declined precipitously; not only in the 104th Congress, but also in the run-up to the election in the 103rd. Take a look at the boxplots[2] above showing the median, inter-quartile ranges, and outliers of the number of cosponsorships made by Republican and Democratic Representatives.
The boxplots show a contraction in the number of bills cosponsored by both Republicans and Democrats in the 103rd and 104th. The Democratic levels increased again in the years following and peaked in the 110th Congress when Democrats were back in control of both Houses. Republican cosponsorships also increased, but not to the same extent, and subsequently contracted again, especially after the rise of the Tea Party movement.
The chart above only shows data for the 114th Congress through the first session – all other Congresses show data for two sessions. Looking at the IQRs all congresses through December 23 of the first session, Republican cosponsorships in the 114th appears to have stabilized at a level very similar to the 112th and 113th post-Tea Party congresses, while Democrats have continued to increase cosponsorships in a three year trend that started after the return of the Republican majority.
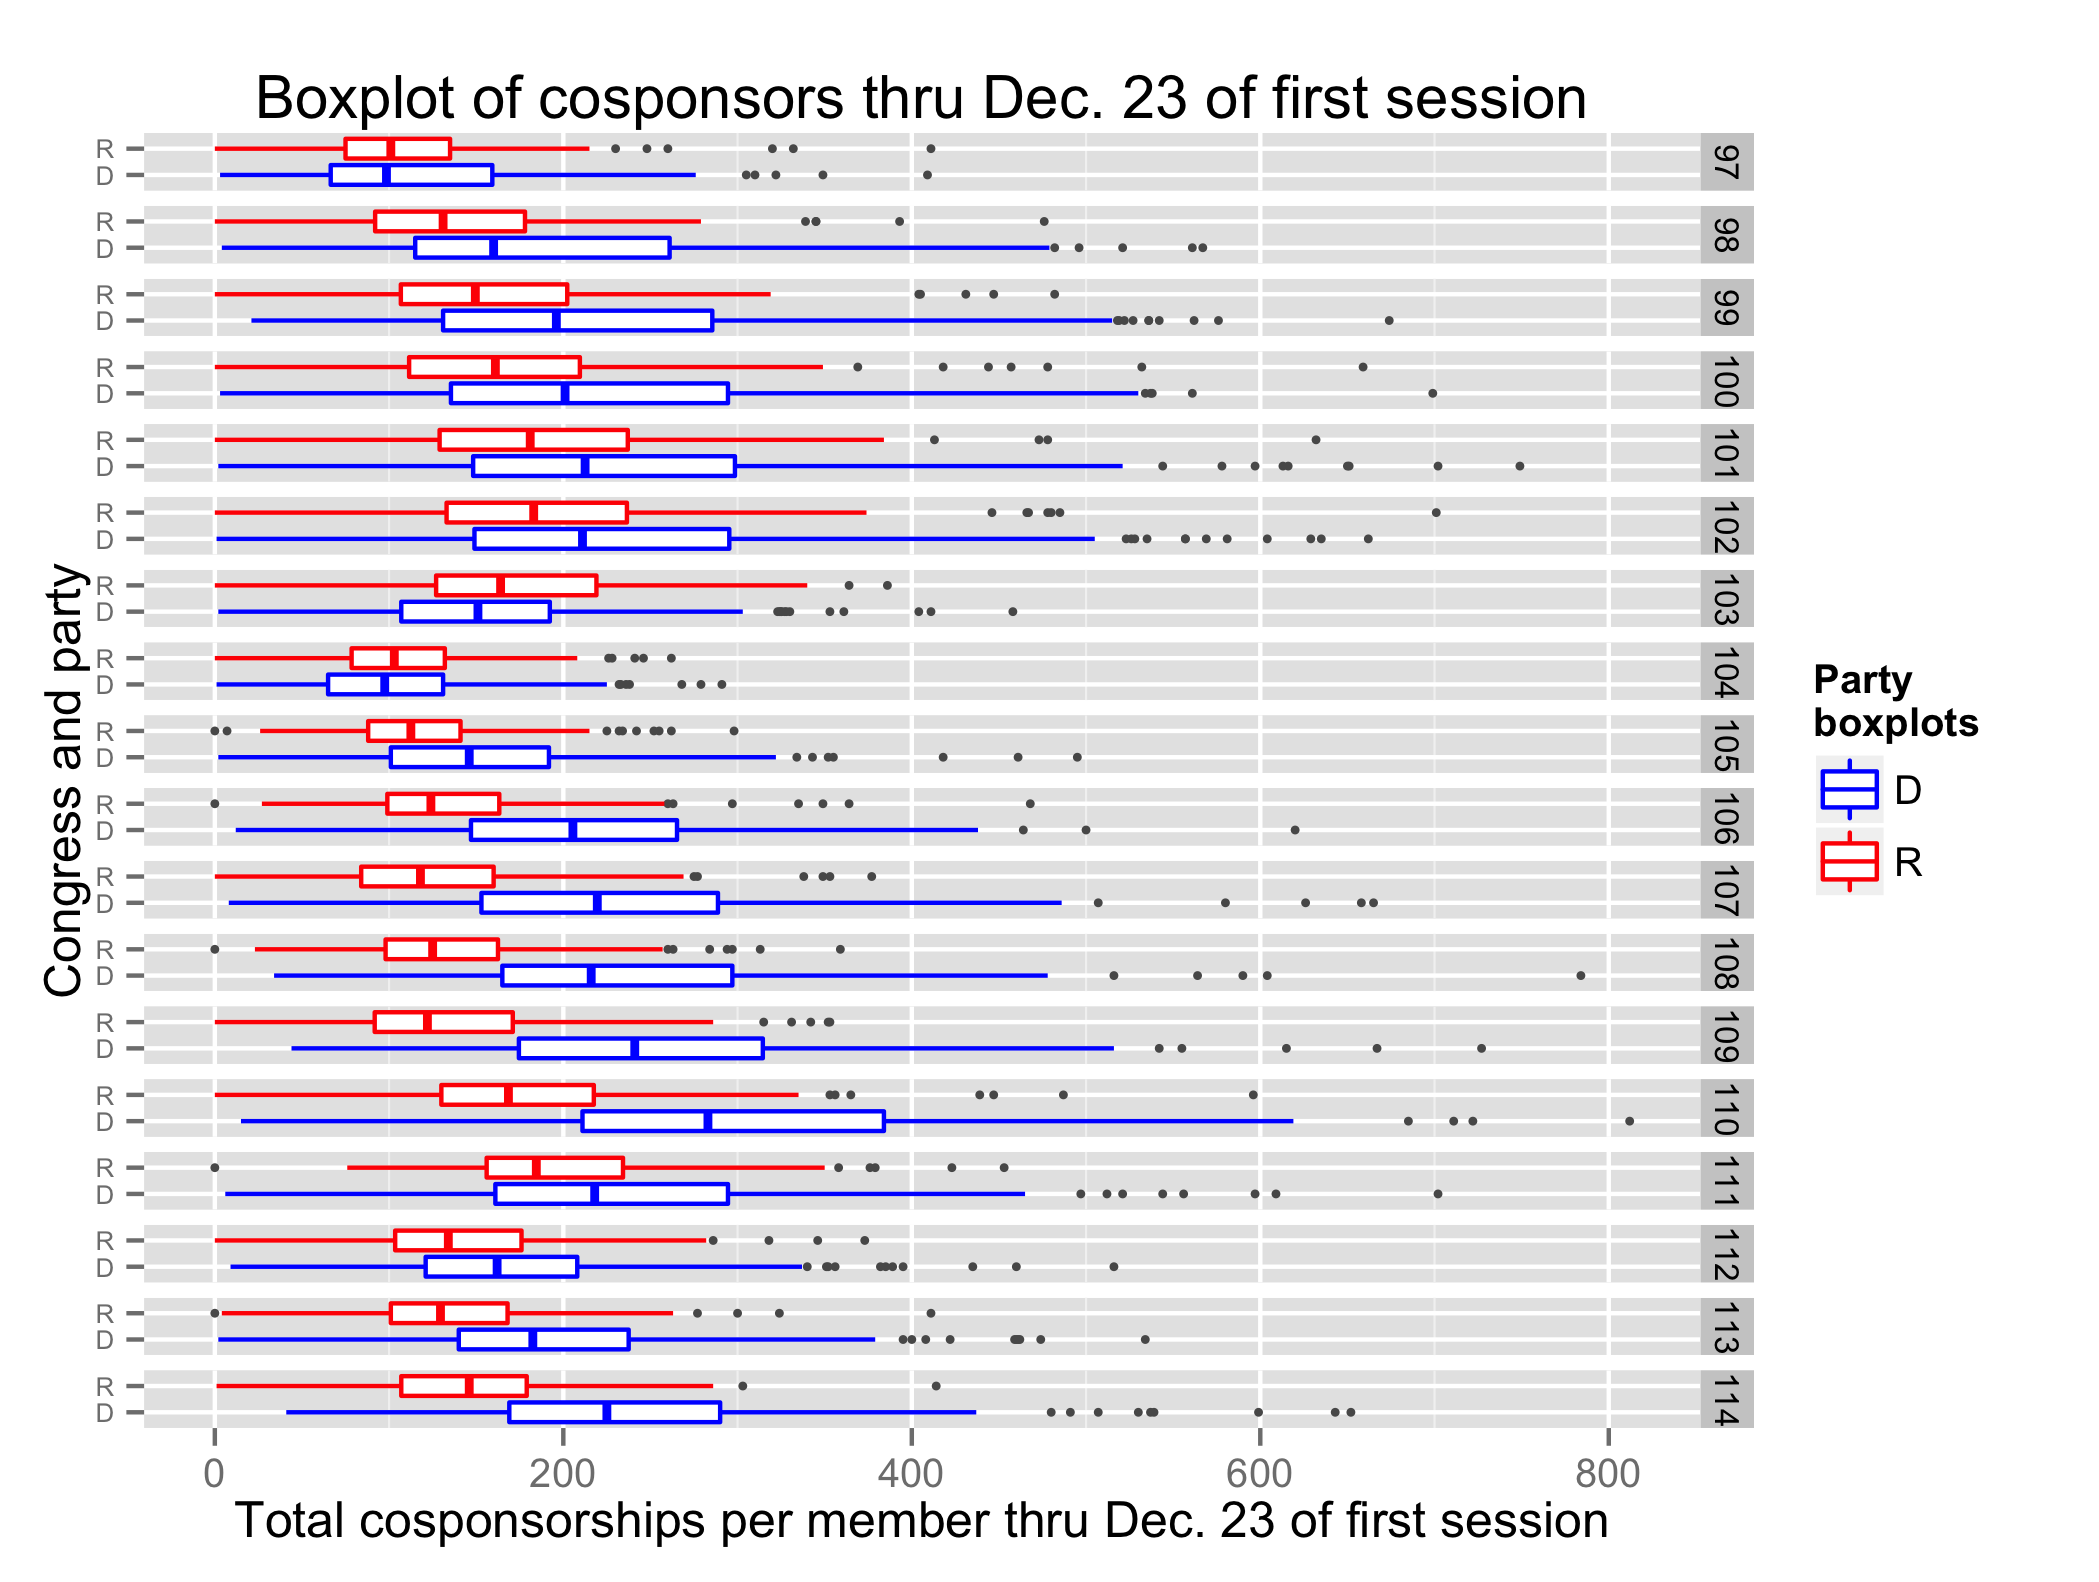
The median Democratic number of bills cosponsored per member has exceeded the median for Republicans in every Congress except the 104th (a reorganization year with many fewer Democrats to propose bills), the 103rd, and the 97th.
The numbers from the 103rd fascinated me. The contraction is a departure from the previous four congresses without a corresponding decrease in the number of Democratic members. What did change in the 103rd is that there was a very large Democratic freshman class of new members immediately prior to the Republican sweep in the 104th. There were 63 Democratic freshmen at the start of the 103rd; and four more Democrats entered Congress at some point during the 103rd. This was the highest level of any of the previous congresses in the chart except the 98th, which had 57 Democratic freshman.
Do freshmen themselves pull the numbers down? I don’t think so. Comparing freshman members to all members that have completed one or more terms, there is not a tremendous difference in the median number of cosponsorships between the two groups.
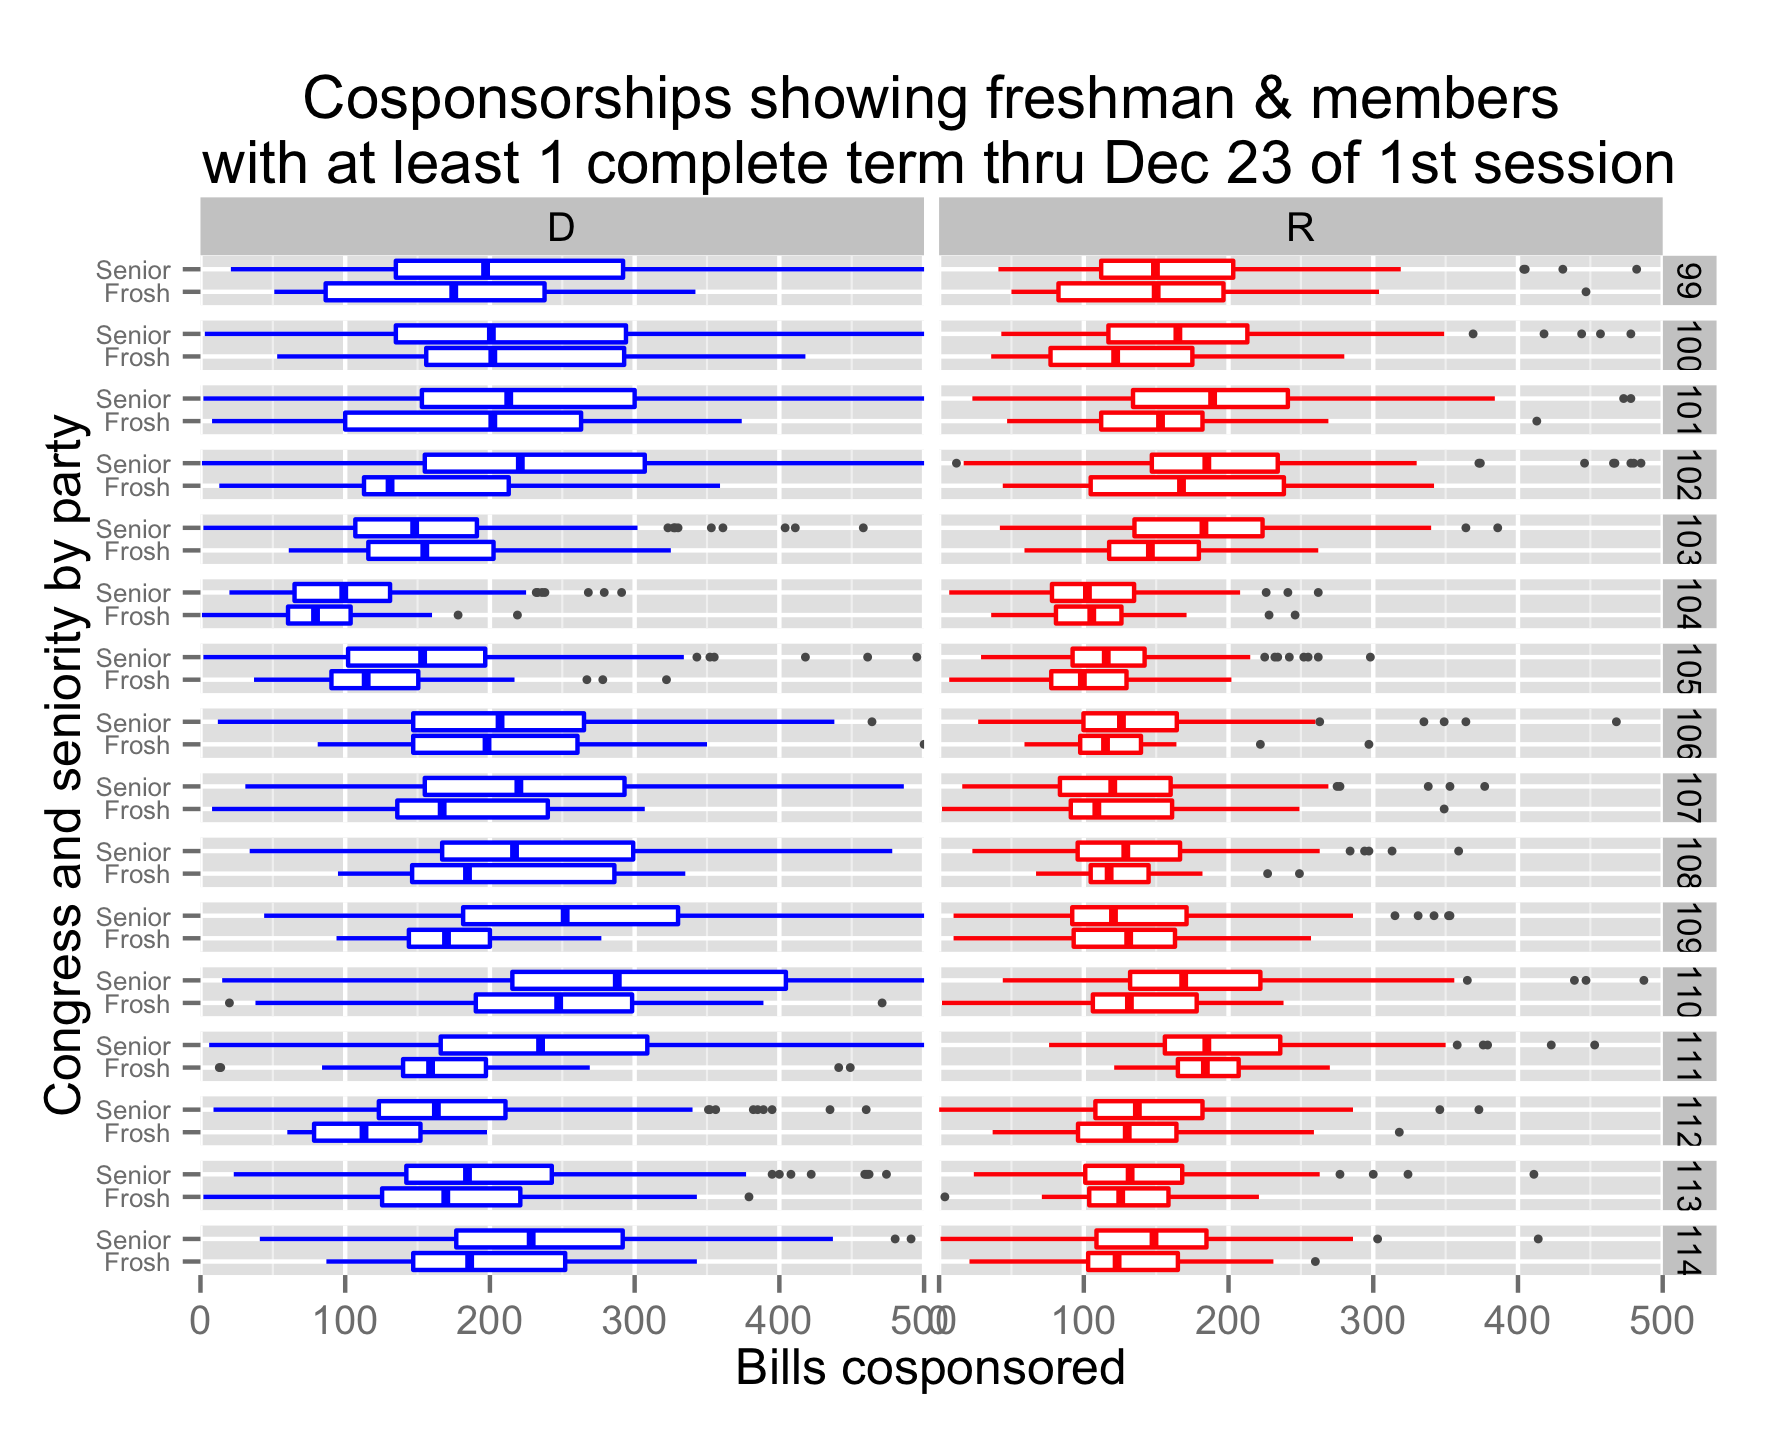
Among Democrats, the median freshmen cosponsored fewer bills in every Congress except two: the 100th (probably skewed by the fact that I only have data back to the 97th Congress – hence less data for senior members), and the 103rd. If freshmen Democrats cosponsored more bills the 103rd than veterans, they cannot explain the decline.
Among Republicans, the median freshman cosponsored fewer bills than senior members in every congress except the 104th. Again, freshmen were not to blame for the decline among Republicans either. Instead, a wholesale shift – a legislative pucker factor – is at work.
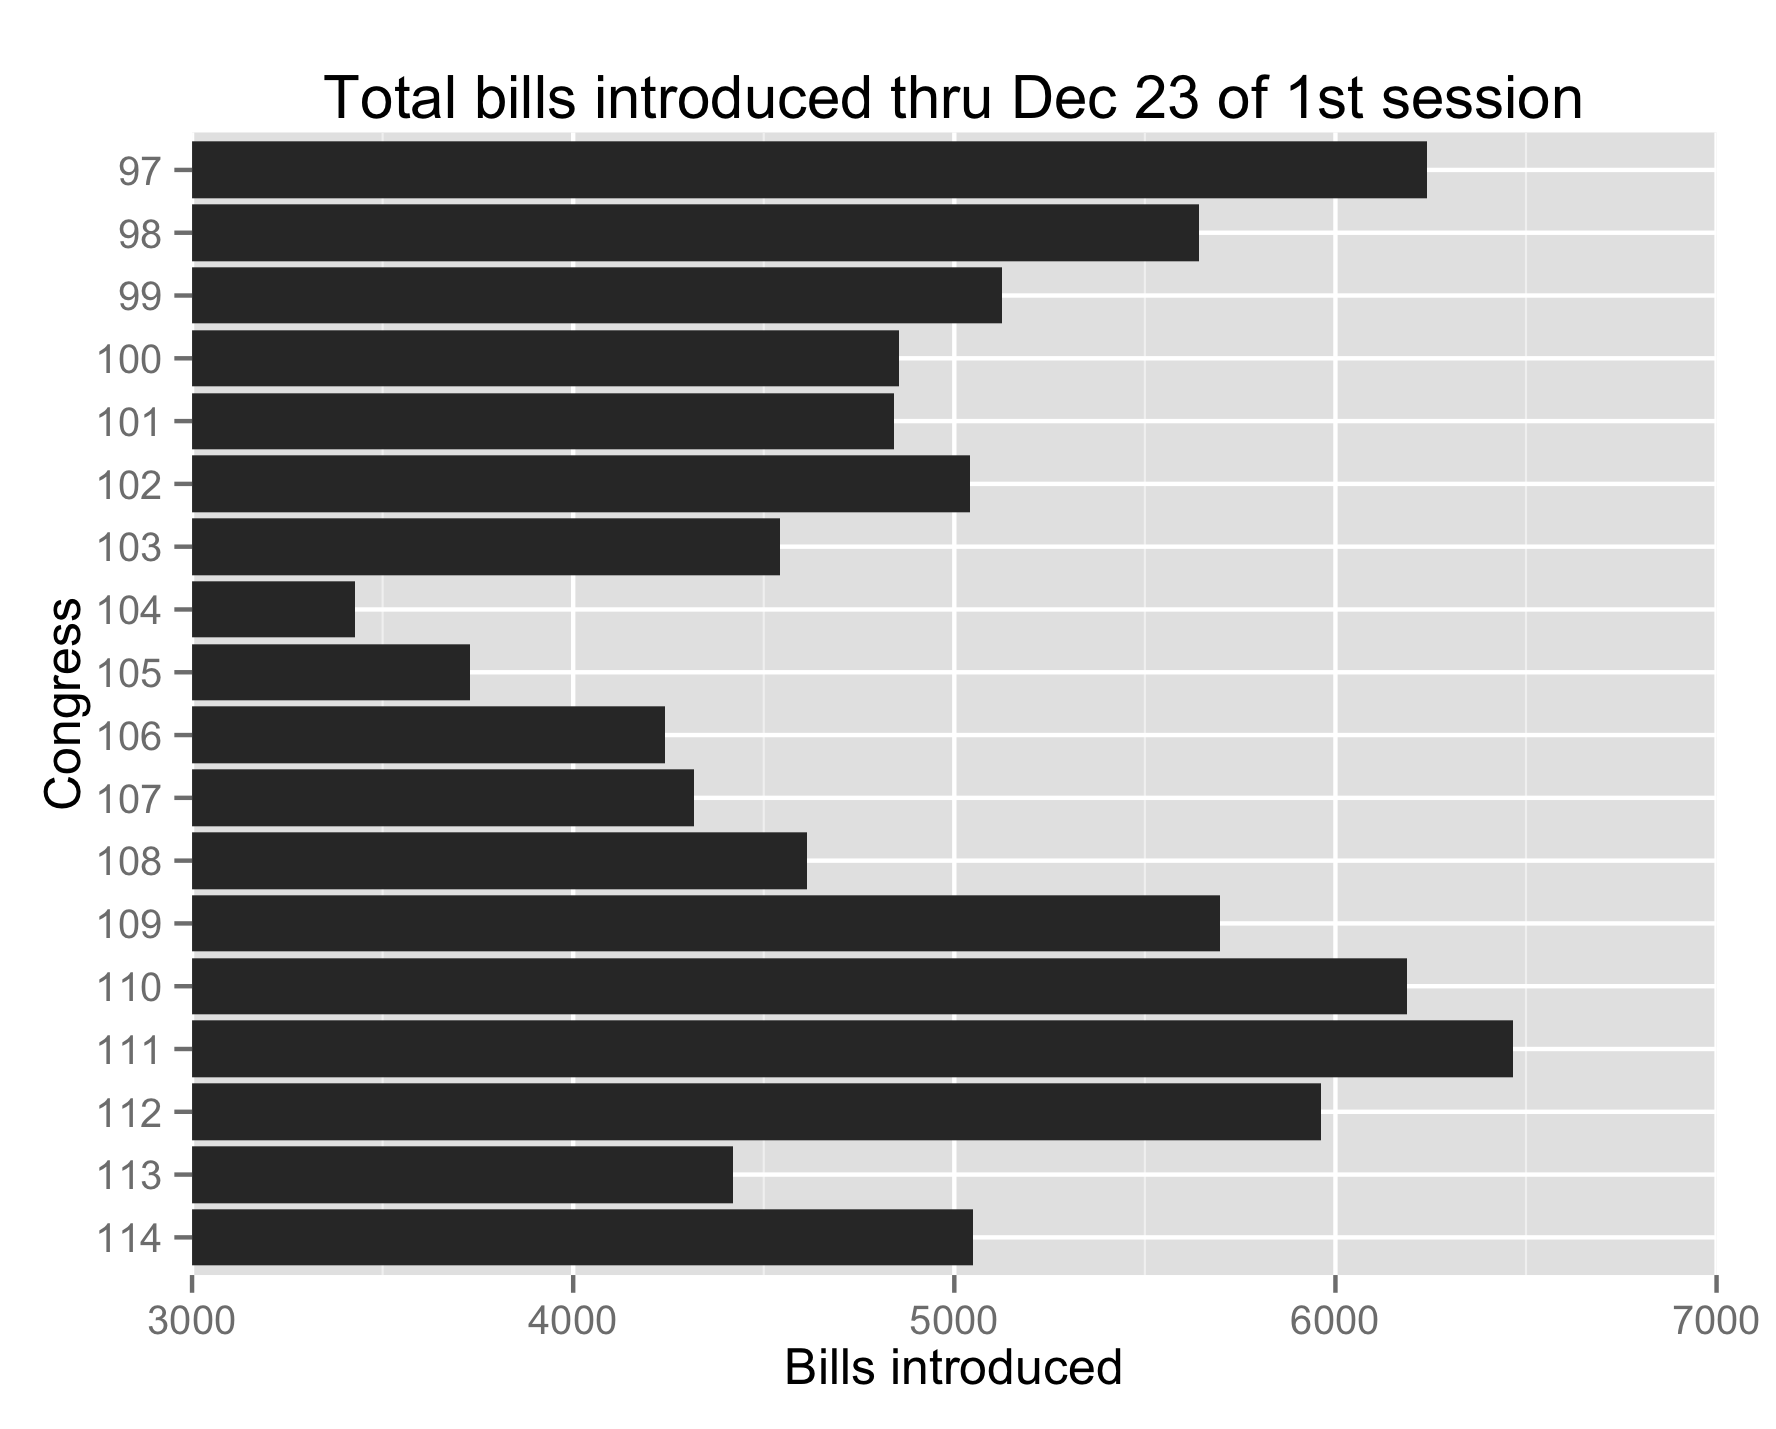
Of course, the number of opportunities to cosponsor a bill is not the same in every congress. The number of bills introduced changes with each congress, and the 104th had the lowest number of bills introduced in the data. Almost twice as many bills were introduced by late December in the 111th Congress.
Mean cosponsorships in each Congress, scaled as though the same number of bills were introduced as in the 114th shows that the 104th was a notable low point for Democratic cosponsorships, and that the 112th and 114th have rivaled that level. Given the number of cosponsorship opportunities for Democrats, their mean cosponsorships in recent congresses are lower than in the 104th.
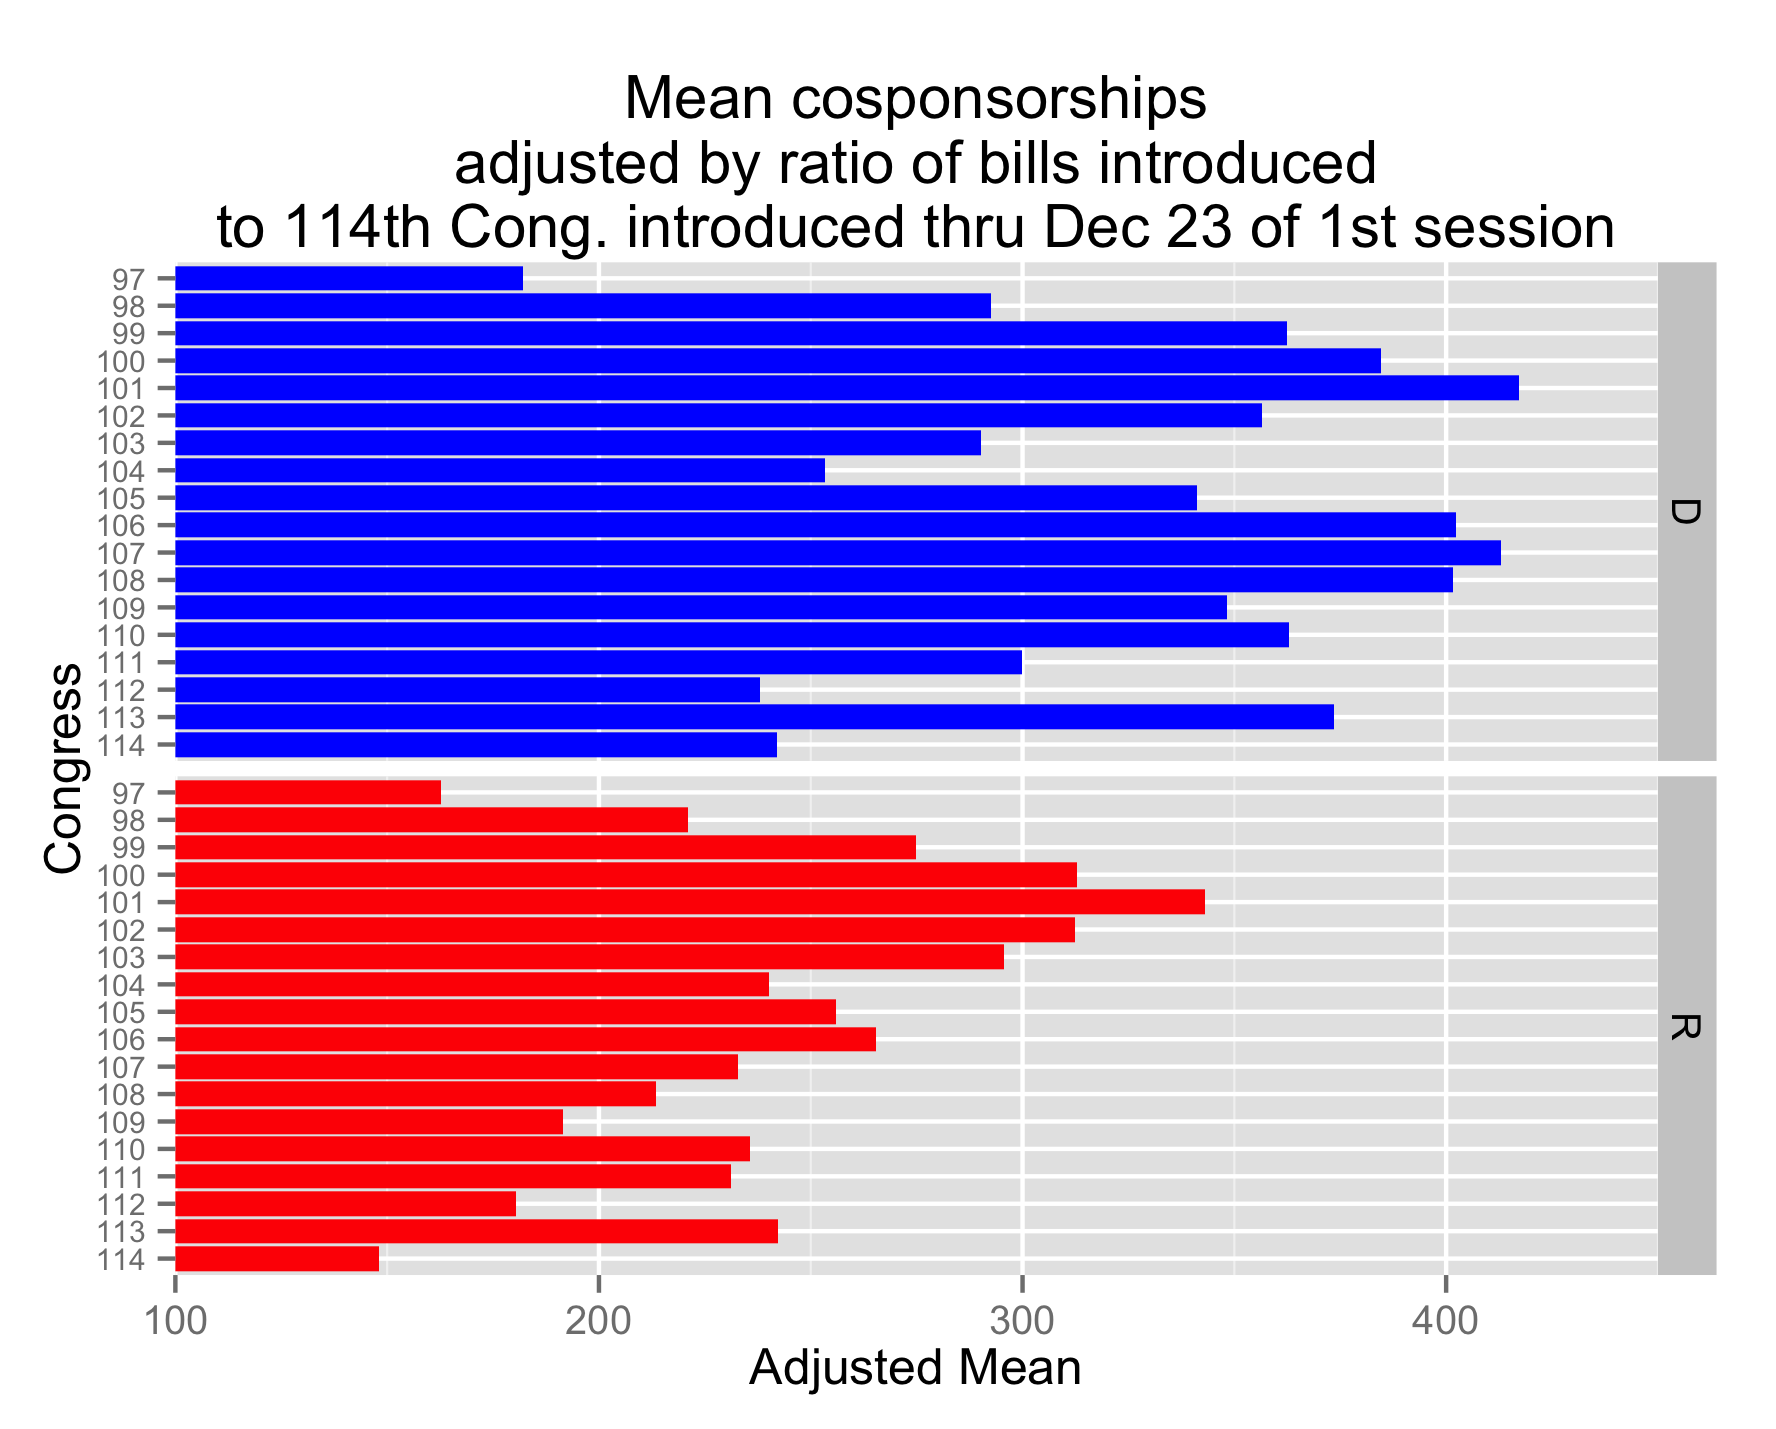
For Republicans, the 104th was a low-point in comparison to the preceding congresses; but unlike the trend for Democrats it also marked the first step in a declining trend in average cosponsorship per member, scaled by cosponsorship opportunities. When weighted by the number of cosponsorship opportunities, the 104th seems like less of an aberration. However, for Republicans the trend started in the 104th has tended to continue to the present day.
Finally, watching the change over time in the behavior of individual members in the following line graph shows the tightening of cosponsorship behavior in another way. Each line shows a member’s cosponsorship trend over time for which more than one Congress of data is available.
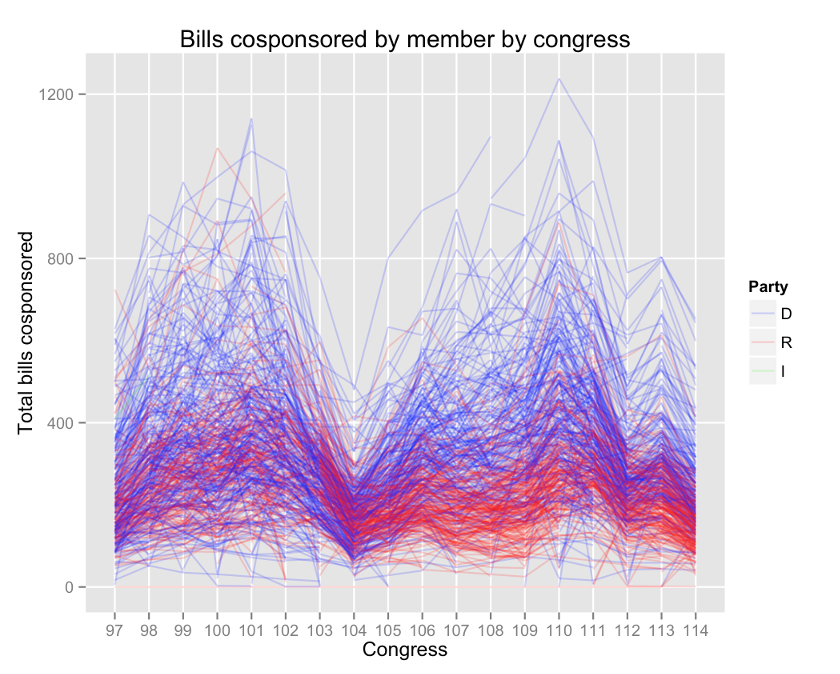
The Republican lines prior to the 104th Congress are more broadly distributed (as reflected in the boxplots in the first figure, above). A consolidation—even among traditional outliers—takes place in the 104th. In the congresses after the 104th, Republicans consolidate into a much tighter band (as also reflected in the width of the boxplots, above), while Democrats seem to dominate the higher ranges of cosponsorships per Congress after the 104th.
Conclusion: Over time Republicans have become less willing to cosponsor legislation and Republicans are much more alike in their willingness to cosponsor bills than Democrats (for example, note the narrower IQRs above). Democrats show more variety in their willingness to cosponsor bills, and on average do so more often than Republicans. Democrats have recently shown less willingness to cosponsor bills (as weighted by the number of bills outstanding) and this tendency has varied congress to congress. Since the 104th Congress, Republicans have shown a continued decreasing tendency to cosponsor bills as a function of bills outstanding.
Notes:
[1] As represented by the inter-quartile ranges (IRQ), the distance between the first and third quartiles. [Return to text]
[2] These boxplots were generated using R with the ggplot2 package. The geom_boxplot function is defined in the help file as follows: “The upper and lower “hinges” correspond to the first and third quartiles (the 25th and 75th percentiles)… The upper whisker extends from the hinge to the highest value that is within 1.5 * IQR of the hinge, where IQR is the inter-quartile range, or distance between the first and third quartiles. The lower whisker extends from the hinge to the lowest value within 1.5 * IQR of the hinge. Data beyond the end of the whiskers are outliers and plotted as points (as specified by [John] Tukey).” [Return to text]
An example of a boxplot over a distribution from Wikipedia:
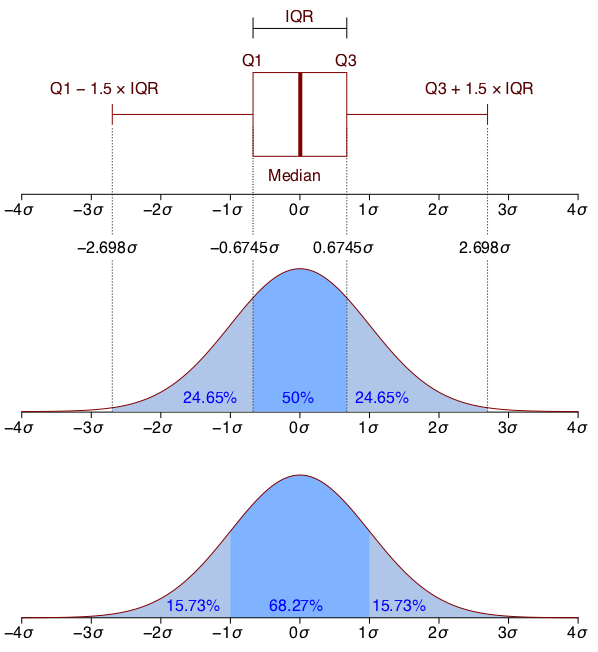
“Boxplot vs PDF” by Jhguch at en.wikipedia. Licensed under CC BY-SA 2.5 via Commons.

